Working with KPIs
Overview
Key Performance Indicators (KPIs) are essential for measuring the success of your GenAI applications. This guide provides practical instructions for creating and managing KPIs in Pay-i, with a focus on using the web interface to configure and view KPIs.
Whether you're evaluating a chatbot's effectiveness, measuring the ROI of AI-generated content, or tracking user satisfaction with your GenAI features, proper KPI implementation is critical for demonstrating business value.
For a conceptual understanding of KPIs in Pay-i, see Use Case KPIs. For comprehensive SDK usage documentation, see Python SDK KPIs.
Understanding the KPI Workflow
Pay-i implements KPIs using a two-tiered approach:
- KPI Definitions: Created at the use case type level (identified by
use_case_name) - KPI Values: Recorded at the use case instance level (identified by
use_case_id)
This important distinction means implementing KPIs is a two-step process:
- First, you define what KPIs exist for a particular use case type (e.g., "Chat-Bot" or "Image-Ad")
- Then, you record actual values for those KPIs on specific instances of that use case type
This approach ensures consistent metrics across all instances of a given use case type, while allowing for instance-specific measurements.
Creating and Managing KPIs
Pay-i offers two ways to create and manage KPIs: through the web portal for a convenient visual interface, or programmatically via the SDK for automation and integration with your applications.
Managing KPIs in the Pay-i Portal
The Pay-i web interface provides a straightforward way to create, edit, and manage KPIs:
Creating KPIs
To create a new KPI:
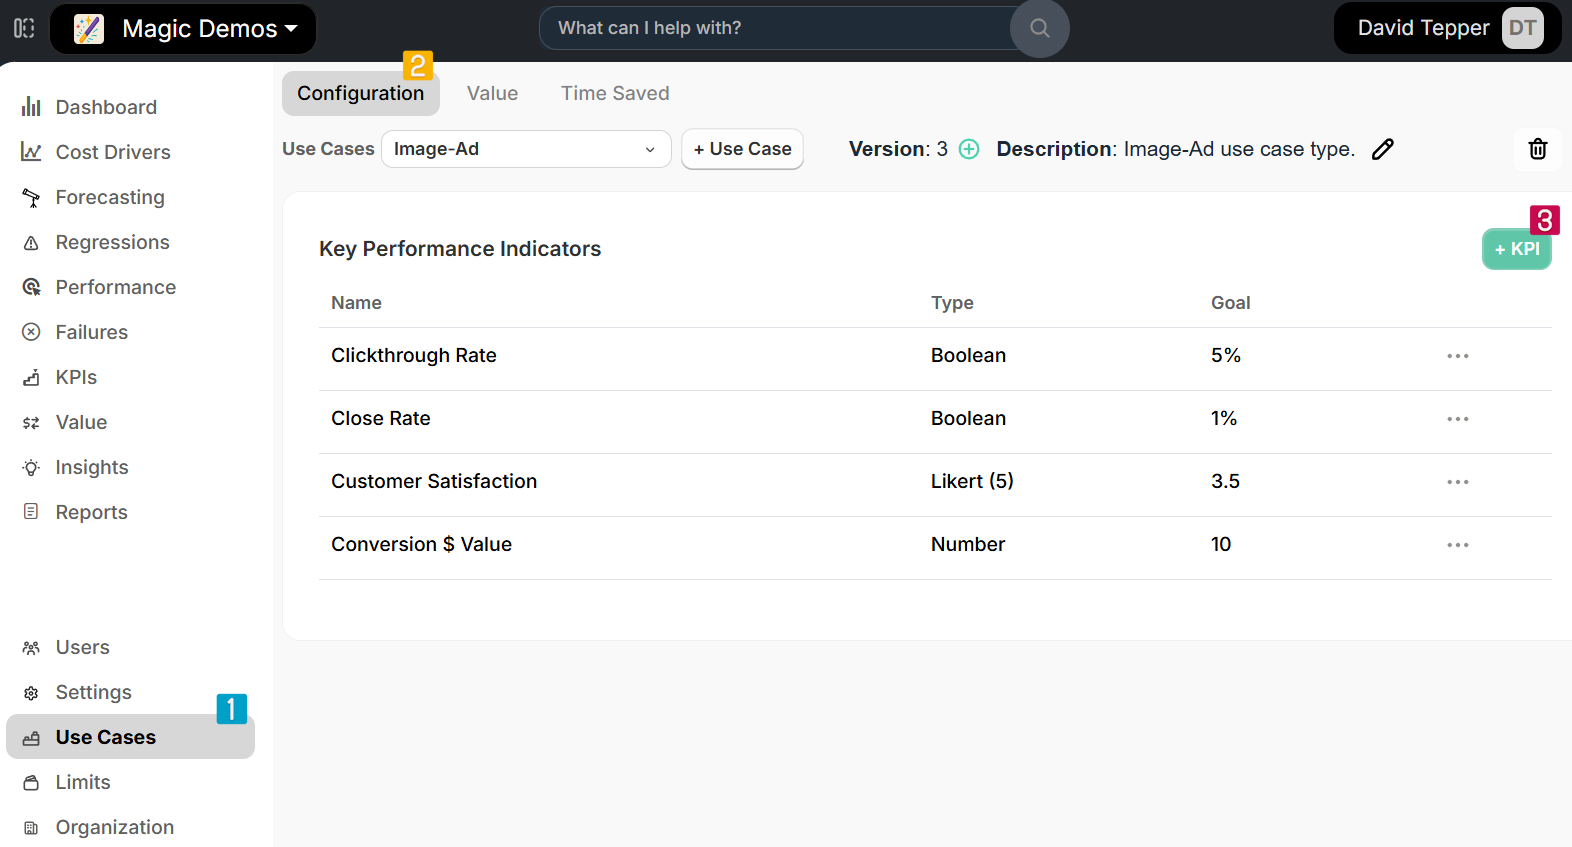
- Navigate to the use case configuration page
- Select the Configuration tab
- In the Key Performance Indicators section, click the + KPI button
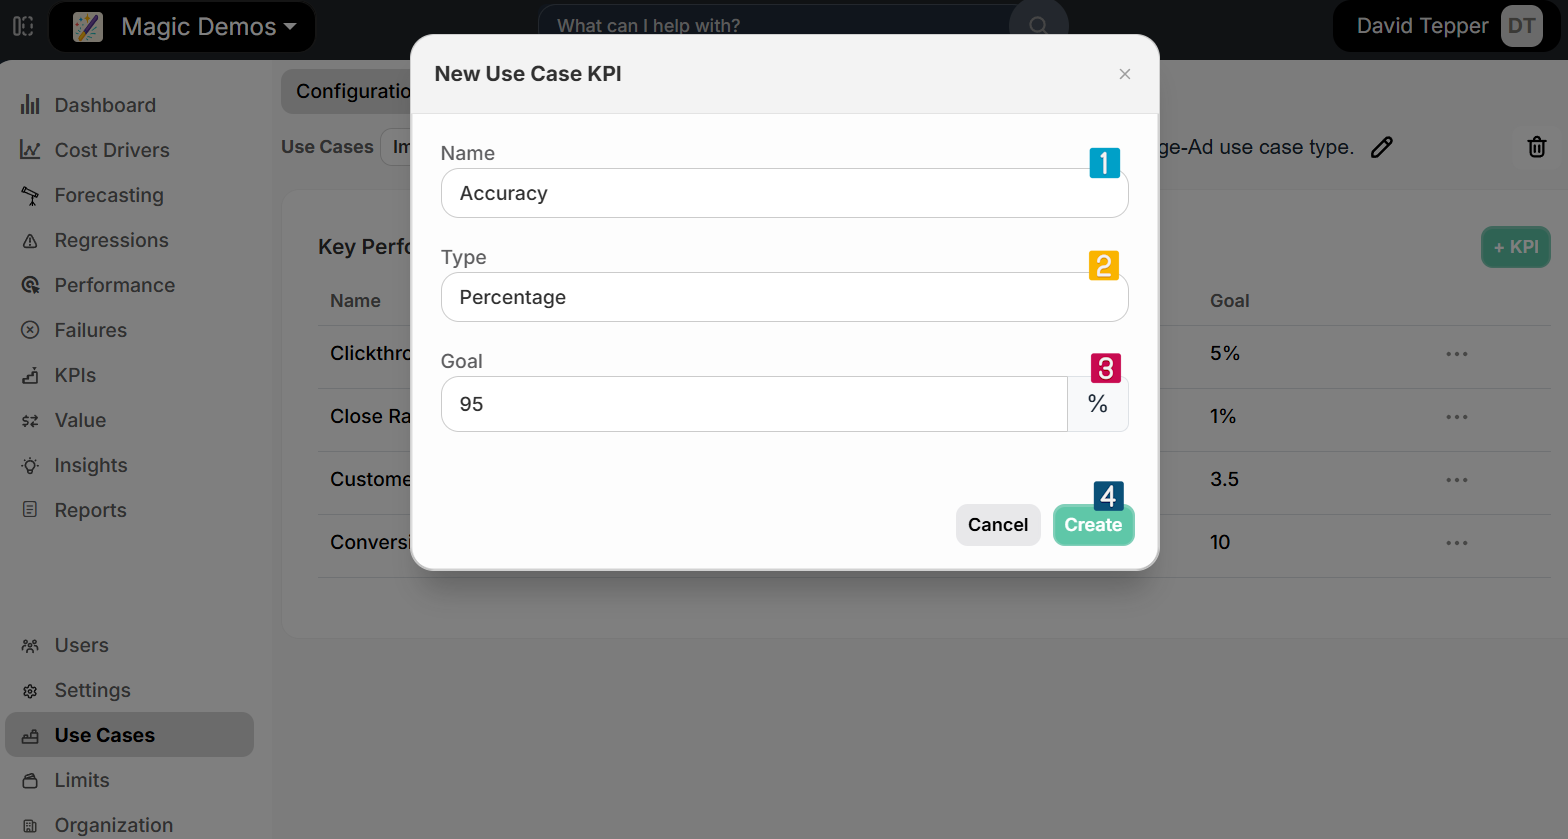
- In the New Use Case KPI dialog:
- Enter a name for the KPI
- Select a type from the dropdown (Boolean, Number, Percentage, Likert (5), Likert (7), or Likert (10))
- Set a goal value appropriate for the KPI type
- Click Create
The KPI will appear in the list with its name, type, and goal value.
Editing and Deleting KPIs
To modify existing KPIs:
- Find the KPI you want to modify in the list
- Click the three-dot menu (⋮) on the right side of the KPI row
- Select one of the following options:
- Edit: Opens a dialog to modify the KPI's name, type, or goal value
- Delete: Removes the KPI from the use case
These management capabilities allow you to adapt your KPIs as your measurement needs evolve or correct any settings if needed.
Real-World Implementation Examples
For complete, ready-to-use code examples showing how to implement KPIs for specific application types, see our KPI Examples from Real Applications guide. This resource includes:
- Chat Bot KPI implementations
- Image-Ad Generation KPI examples
- Document Processing KPI patterns
- Text Generation KPI approaches
- Funnel Conversion KPI tracking
- Error handling best practices
These examples provide practical starting points you can adapt for your own GenAI applications.
Analyzing KPI Data in the Pay-i Dashboard
Pay-i provides sophisticated visualization tools for analyzing your KPI data:
Dashboard Visualizations by KPI Type
The Pay-i dashboard automatically adjusts visualizations based on the KPI type to provide the most meaningful representation of your performance metrics:
-
Boolean KPIs (like Deflection Rate and Clickthrough Rate):
- Displayed as true/false distributions with bar charts showing count of true vs false values
- Automatically calculates percentage of true values as the average score
- Example: A Clickthrough Rate KPI might show 5.23% True (Goal: 5.00%)
- Visual representation highlights both the raw count and percentage of successful outcomes
-
Numeric KPIs (like Conversion $ Value):
- Displayed as histograms showing distribution across value ranges
- The x-axis represents value ranges (e.g., $0-$5, $5-$10, $10-$15, etc.)
- The y-axis shows count of occurrences within each range
- Average value is calculated and displayed compared to goal (e.g., $12.47 (Goal: $10.00))
- Distribution patterns help identify outliers and concentration areas
-
Likert Scale KPIs (like Customer Satisfaction):
- Displayed as histograms showing distribution across the scale points (1-5, 1-7, or 1-10)
- Shows how many responses fall into each rating category
- Automatically calculates the average score (e.g., 3.85 / 5.00 (Goal: 3.50))
- Visual representation makes it easy to see sentiment distribution
For each KPI type, the dashboard also provides:
- Goal attainment indicators (whether you're meeting your targets)
- Trend analysis to track changes over time
- Filtering options by date range, use case version, and other parameters
Dashboard Elements
The Pay-i KPI dashboard provides:
- Time-series graphs showing KPI performance over time
- Distribution histograms showing value patterns
- Summary metrics including:
- Average score
- Goal values
- Percentage of goal met
- Use cases reviewed percentage
- Filtering options by date range and use case type
Trend Analysis
Track changes in KPIs over time to identify:
- Performance improvements
- Degradation patterns
- Correlation with system changes
- Seasonal variations
Comparative Analysis
Compare KPIs across different dimensions:
- Between different use cases
- Across different time periods
- Before and after system changes
- Against established benchmarks
Relationship to Value Metrics
While KPIs focus on measuring specific performance metrics for your applications, Pay-i also offers Value metrics as a complementary system for measuring broader business impact and ROI.
Value metrics use Business Equations that can incorporate both standard metrics (like Instance Cost and Instance E2EL) and your custom KPIs to calculate comprehensive business value. For example, a Value metric might use your "time saved" KPI as part of a more complex ROI calculation.
For information on implementing this complementary measurement approach, see Value Metrics.
Related Resources
- Learn about the core concepts of KPIs in Pay-i in the Use Case KPIs guide
- For implementation strategies and best practices, see KPI Best Practices
- For information on measuring business value through Value metrics, see Value Metrics
Updated 2 months ago